Week 10: CDC Compliance: Chicago.
In order to not go completely insane, I’ve been taking a lot of walks. I try to be careful – I wear a mask and I stay 6 feet from others whenever possible – but there is one problem that I keep running into… (it will be a pun, trust me.)
Usually I can sense it approaching. I hear the shoes hitting the ground and the heavy breathing. And then I turn my head and a runner is breathing into my face with no mask (see, there’s the pun. Running.). Maybe it’s just me but I think they try to get as close to my face as possible so they can push their heavy exhales into my lungs. I know. Gross.
Anyway, budding data analyst that I am, I decided to test my hypothesis. For what felt like hours but was probably 30 minutes, I stood in my pajamas, notebook in hand, spying on the passersby, and tracking the following variables for 101 people:
- Mask (on the mouth and nose)
- Distancing (6ft or it don’t count. Based on my best judgment of if groups were a household, a couple, friends, etc.. Imperfect but most people were not in groups)
- Activity (walking, biking, or running)
- Age (kid, adult, senior. Everyone was an adult though so I didn’t use this)
- Sex (this is based on my perception and may not be accurate in some cases. Gotta note my biases)
- Compliance (mask OR distancing based on CDC guidelines)
Once I had gathered all my data from creeping it was time for the fun part. Yes, I do find this stuff fun.
I started off with some clustering. What does that mean? It means I taught my computer all of the information I gathered. I told it to look at all the cases (1 person = 1 case) and group the similar cases into clusters based on the distance between them. In actuality, it’s more complex and if it makes no sense at all to you, don’t worry. The most important thing to understand here is that we’re looking for patterns in the data.
Based on the data, I found that people broke up into these 5 groups:
- compliant male runners
- compliant walkers
- non compliant walkers
- mostly compliant male bikers
- non compliant female runners
These groups are not perfectly clear cut by variable, but they are pretty close. If you want the numbers for yourself, shoot me an email!
This was a bit surprising to me. I had assumed that men would be less compliant because I have more faith in my gender, but the data called me out on my biases and shows predominantly male groups to be categorized as compliant. But this does not tell me anything about how many people fall into groups and how the numbers themselves play out. So I made some graphs because I love a good visualization.
First and foremost, Male vs Female… Not directly related to my runner hypothesis but still interesting.
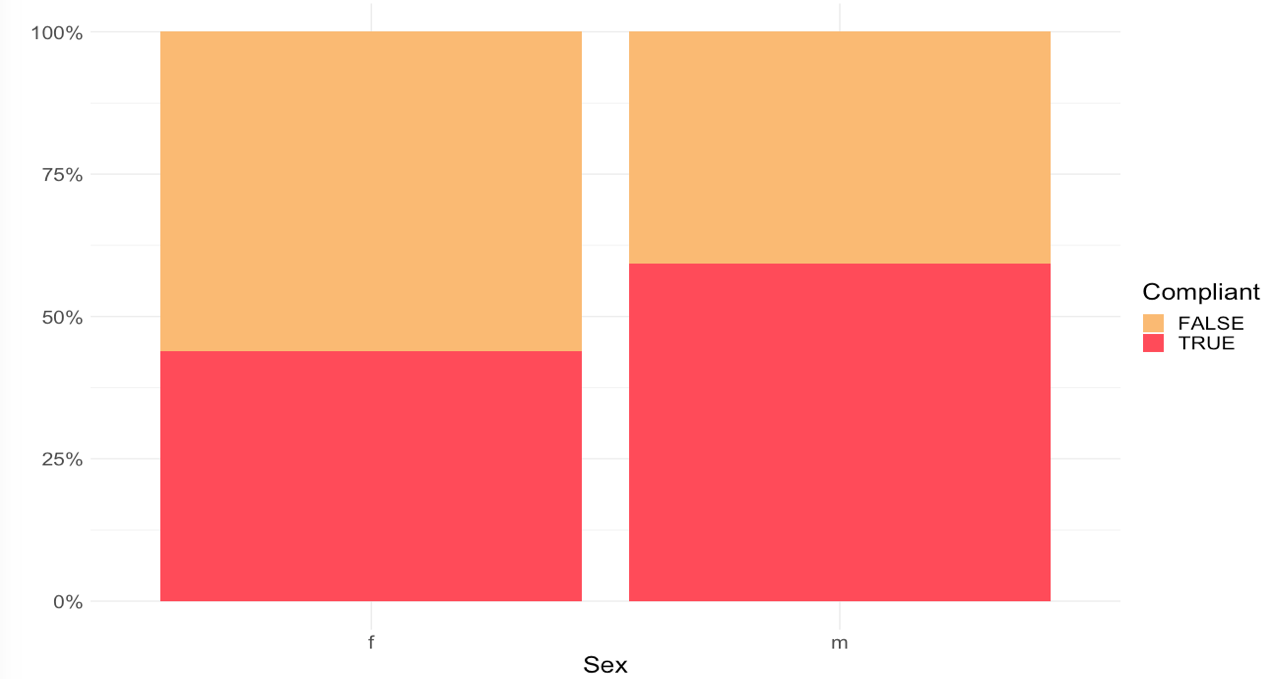
Not only is everyone doing poorly with mask wearing and social distancing, but it appears that women are doing worse than men. Not great. Work on it.
But back to my main point – am I crazy, or are runners being selfish, non-compliant disease vectors?
Let’s look at mask usage first:
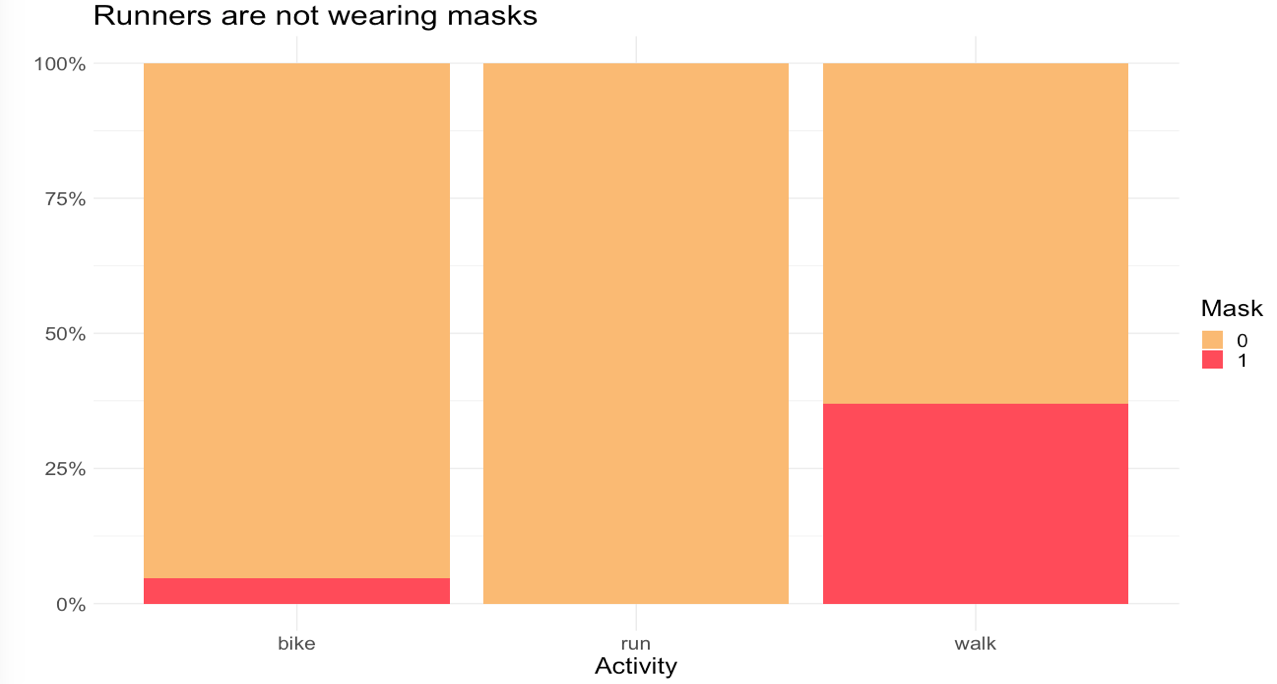
Unsurprisingly, we have terrible numbers across the board, but the worst is for runners and bikers. This makes sense because it’s harder to breathe wearing a mask if you’re exercising. Plus if you’re far from other people, you can still follow CDC guidelines. Let’s see if people are doing that.
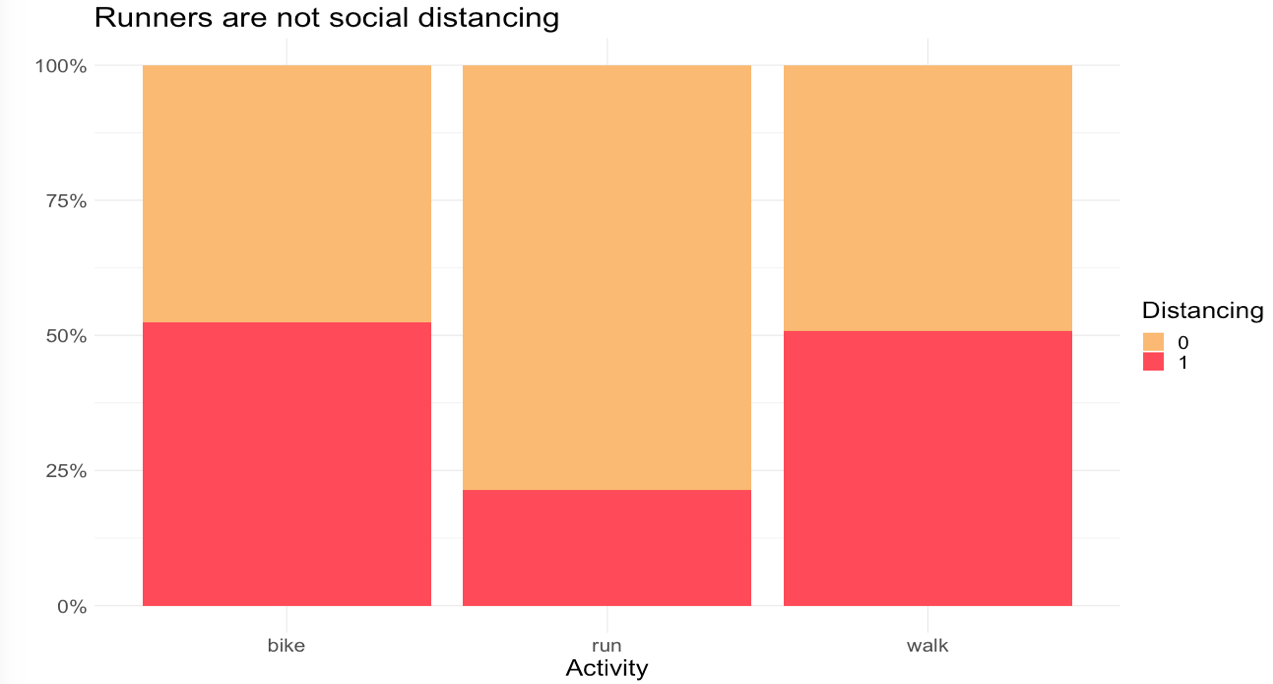
No not really. Bikers in Chicago are in the street where it is easier to be distant so this makes sense. The non-distancing bikers were people trying to pass each other, people biking side by side, and one full grown adult man biking on the sidewalk.
Here’s what it looks like when we put it all together, looking at overall compliance with CDC guidelines:
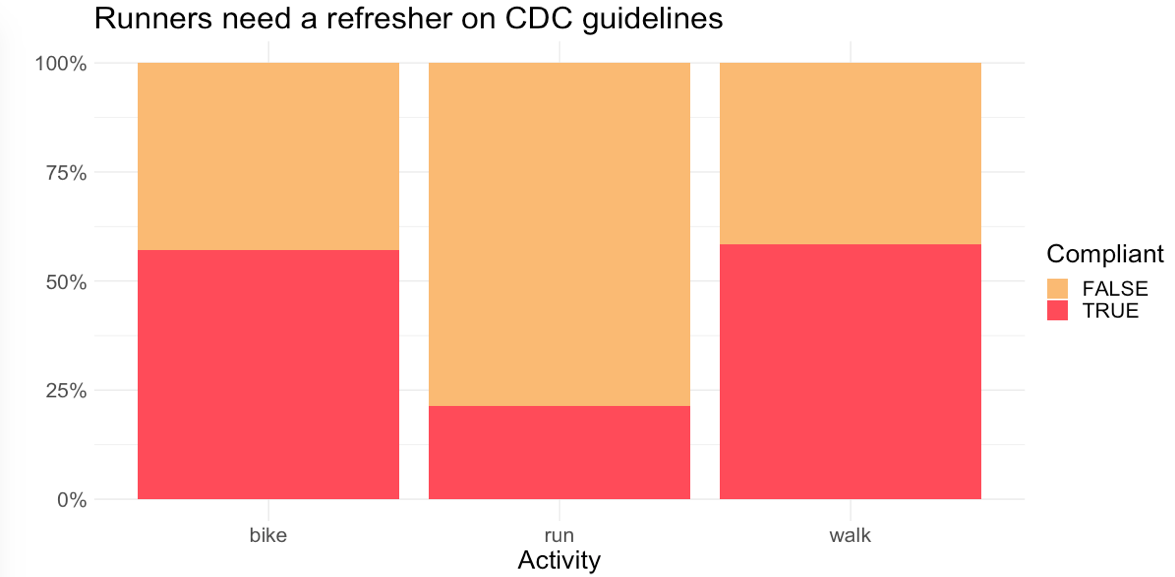
So I guess I was right. Runners are the worst. Pull it together. Runners, if you’re out there reading this, just move over. If people walking can do it, then you can do it too.
This is the ninth in a series of posts From Quarantine. Most posts from quarantine are prompted by Aisling Quigley’s Data Storytelling class at Macalester College. This is not one of those posts.